ARTH
ARTH
GEO INTELLIGENCE
02 / Mission & domains

Earth observation & GeoAI
for people, places, and livelihoods

Our mission is to close environmental blind spots so communities, businesses, and public agencies can protect lives, livelihoods, assets, and ecosystems.

CURRENT · WILDFIRE

Wildfire

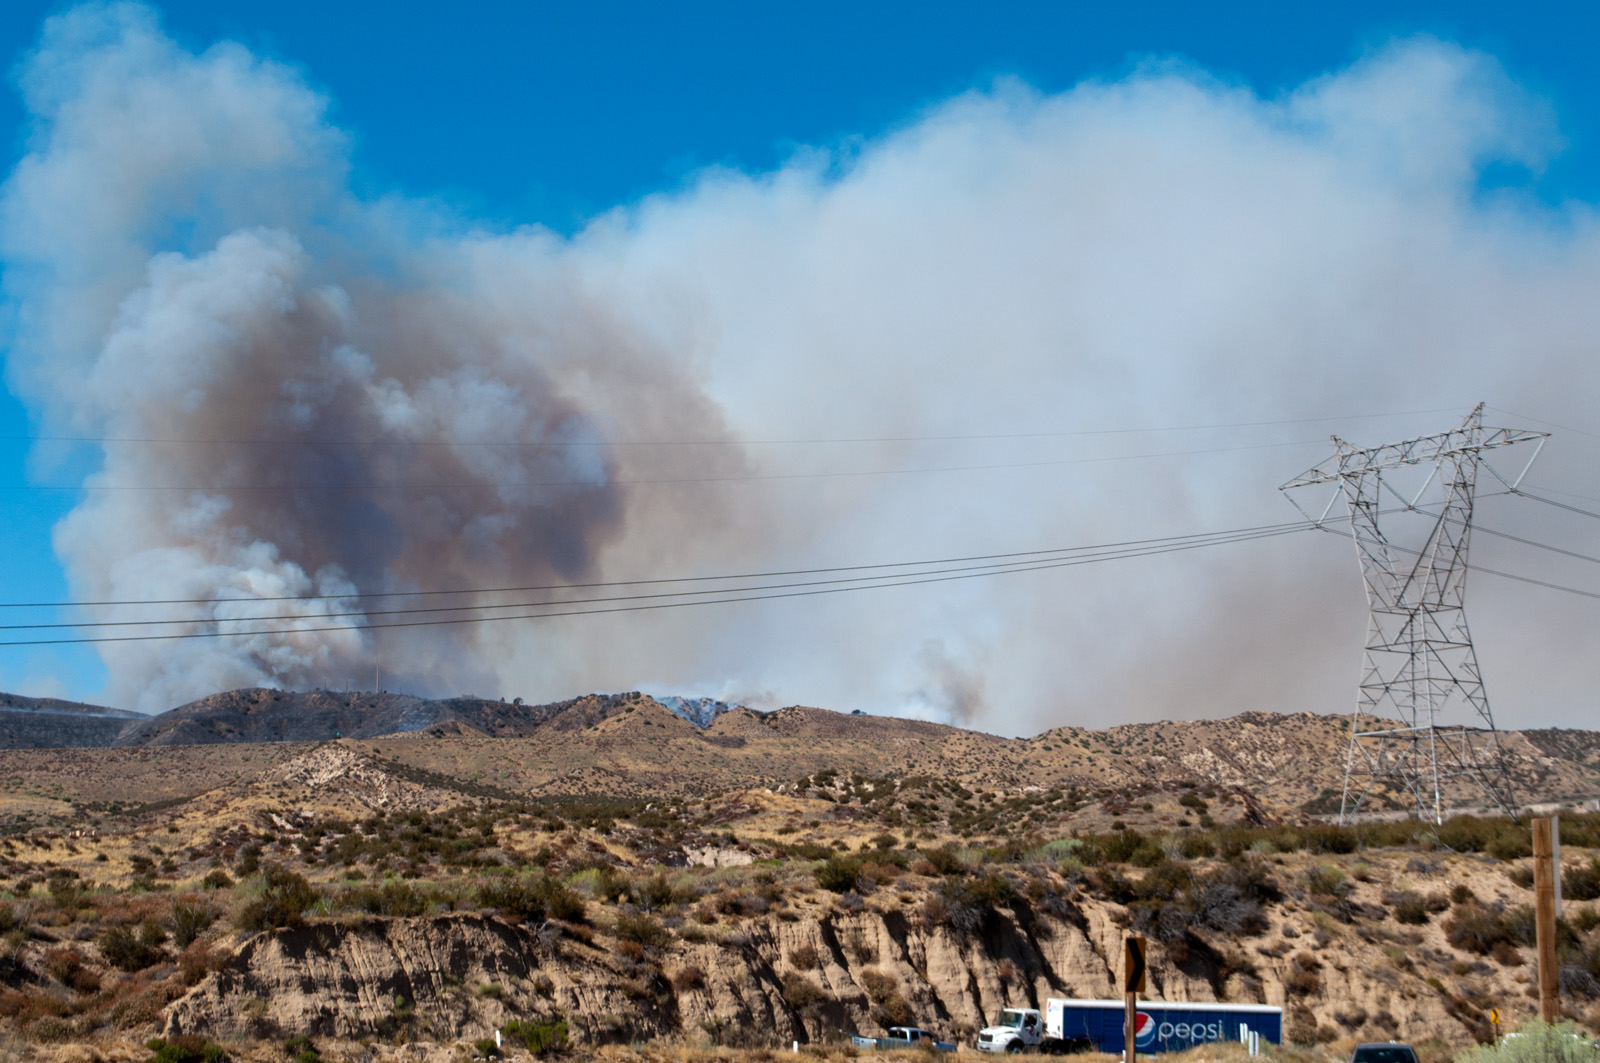
FireScore, thermal activity, fire growth monitoring, asset exposure, and day-ahead FireOutlook.

NEXT · VEGETATION FIRST

Drought & vegetation

Vegetation health, soil moisture, drought severity, and fuel conditions.

LONGER-TERM

Flood & water

Water extent, flood duration, and surface-water dynamics for response and planning.

NEXT · CUSTOMER-LED

Smoke & air quality

Plume awareness, downwind population exposure, PM2.5 context, and advisory support.

LONGER-TERM

Agriculture

Crop and heat stress, irrigation intelligence, planting windows, and extreme-weather response.

LONGER-TERM

Urban heat

Neighborhood heat exposure, infrastructure risk, and resilience planning.

Roadmap: smoke and vegetation next; other domains require customer evaluation and validation. Outlook expansion target: up to 15 days.

03 / Why now / stakes

When data arrives late,
decisions become reactive

Late information leaves exposed communities and businesses making reactive decisions.

$320B

Global natural-disaster losses in 2024

Munich Re
$140B

Insured portion of 2024 disaster losses

Munich Re
~56%

Uninsured share of those losses

Calculated: ($320B − $140B) / $320B
$2.3T+

Annual disaster costs including cascading and ecosystem effects

UNDRR · GAR 2025

These figures describe different loss and spending categories.

04 / Competitive landscape

Spatial detail and observation cadence
across the satellite and risk stack

SystemSpatial measureRefresh / revisitRole and tradeoff
LEO / VIIRS in FIRMS375 m imagery~2 passes/day per satelliteFine detail; observation gaps between passes
GEO / GOES ABI · NGFS2 km fire-channel pixelsEvery 5 min · CONUSFrequent coverage; coarse thermal pixels
OroraTech200 m thermal imageryOrbit-dependent; ~30 min constellation targetOwn satellites plus public-source data
FireSat80 m imagery; 5 × 5 m fire detection≥2/day initial service; ≤1 hr target by 2029Revisit improves with constellation buildout
First Street / Cotality (CoreLogic)Modeled property-level riskModel and scenario updatesRisk assessment, rather than observation cadence
ARTH / FLARE~250–450 m reconstructed gridsEvery 5 minFine-grid radiance at GEO observation cadence

Image resolution, minimum detectable fire size, and reconstructed grid spacing are different measures. Revisit varies with location and mission phase; targets are labeled.

Sources: NASA VIIRS · NASA FIRMS · NOAA ABI · OroraTech sensor · revisit target · FireSat · First Street · Cotality

05 / How it works

ARTH creates
the missing observation layer

ARTH builds on existing satellites. No new orbital hardware is required.

01

Geostationary observations

Public GEO inputs, with five-minute CONUS observations and cloud-accessible archives.

02

ARTH GeoAI

Physics-aware reconstruction designed to retain spectral relationships.

03

Multispectral data

~250–450 m reconstructed observations, refreshed every five minutes.

04

Derived layers

Radiance feeds brightness-temperature layers, FireScore, and inputs for customer models.

05

Data delivery

Package current and historical observations for API access and COG / Zarr workflows.

~250–450 mReconstructed output grids
5 minObservation refresh
65M+Pixels / layer / scan
COG + ZarrData delivery formats
06 / FLARE

FLARE turns observations
into a wildfire workflow

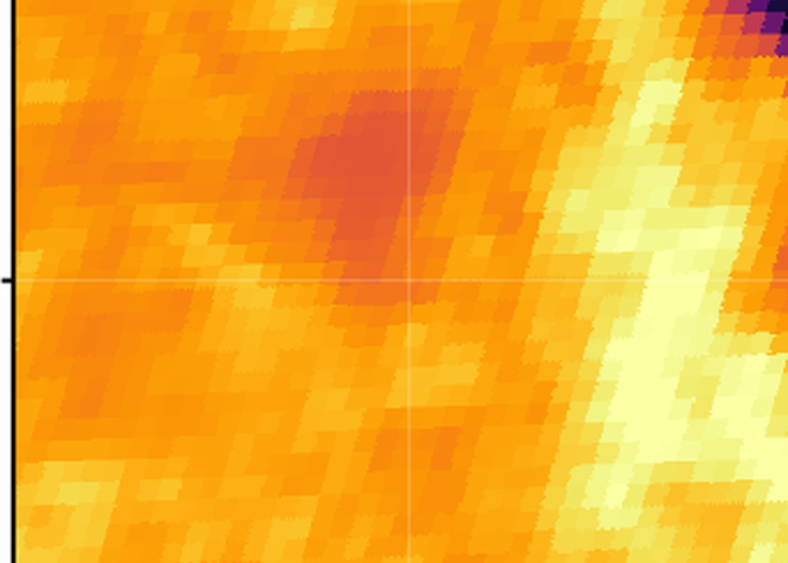
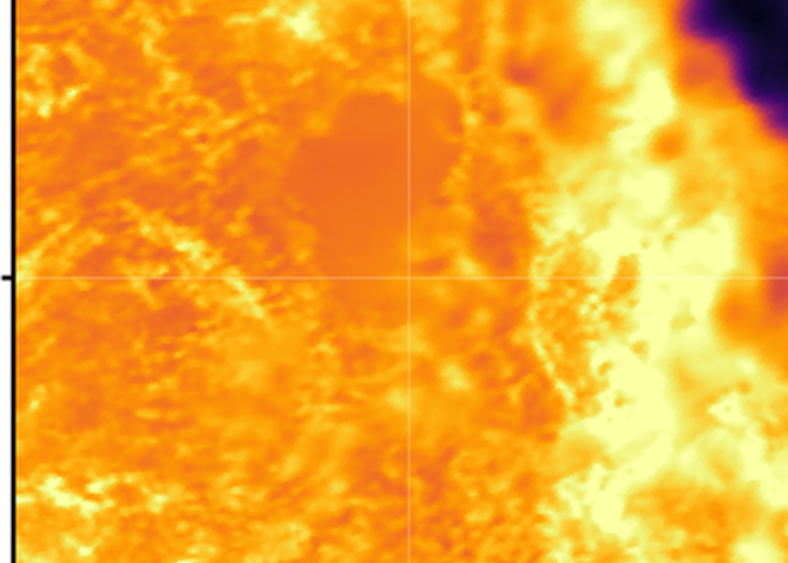
GOES ABI C07 thermal sceneFLARE reconstructed I04 scene
GOES C07 → FLARE I04 · 20 Jun 2026

01 · Monitor conditions

Inspect thermal activity and FireScore to identify locations that need closer attention.

Compare spatial detail ↗
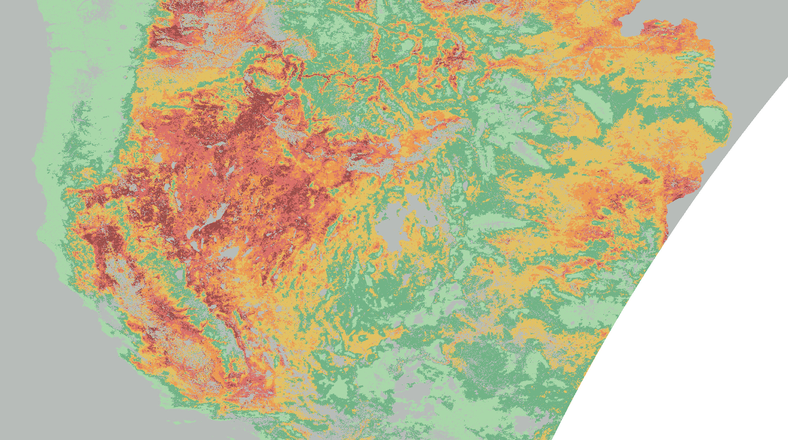
Western US landscape outlook from flyerLandscape context

02 · Plan the response

Use day-ahead FireOutlook to prioritize areas for monitoring and preparedness.

Explore the full story ↗
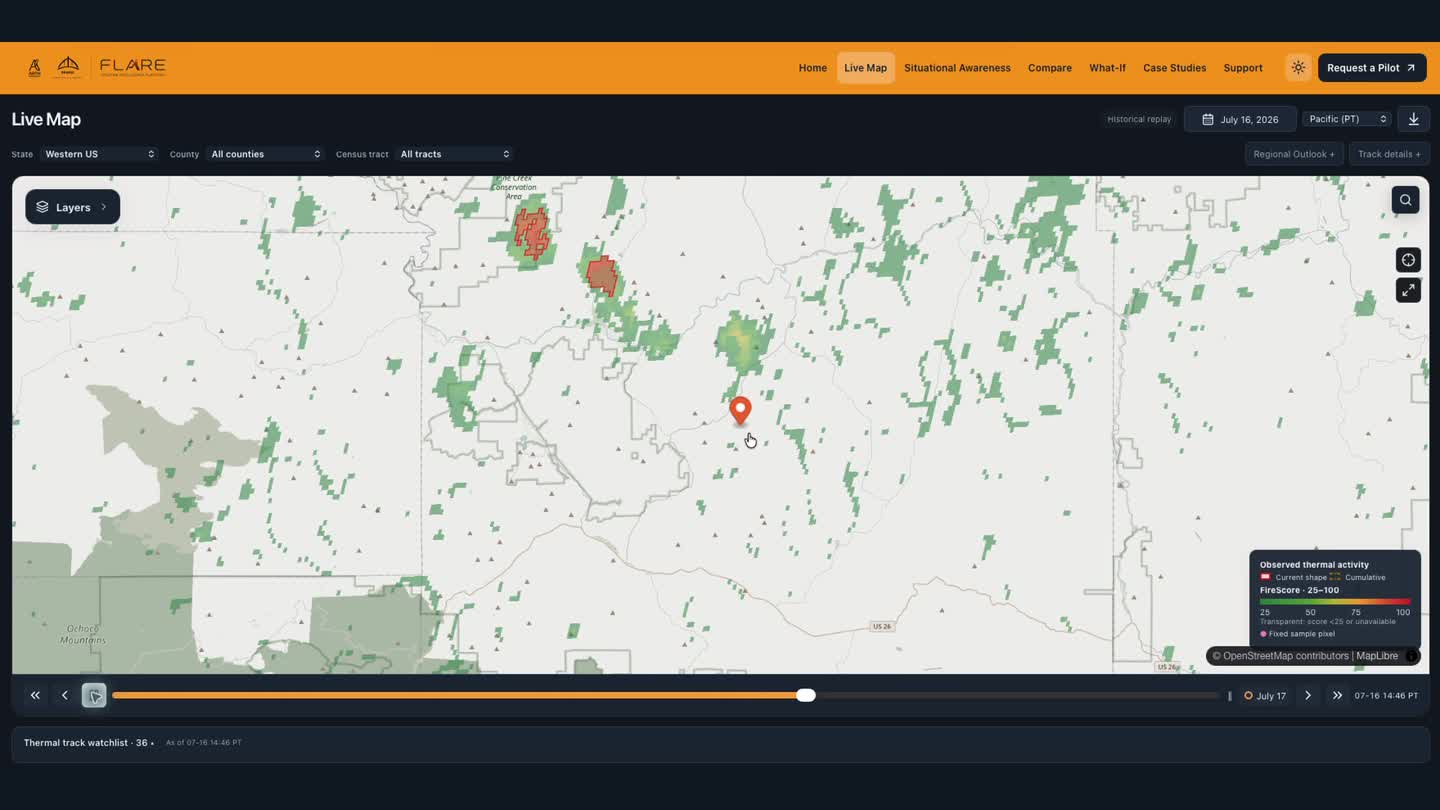
Recorded FLARE dashboard replay in Central OregonRegional monitoring and replay

03 · Review the event

Replay FireTrack observations and assess changing activity around customer locations.

Watch the dashboard demo ↗
Census-tract risk and impact analytics: people · infrastructure · ecosystems · economy

Thermal pair: same region and time; approximate spectral pairing and shared display range. FireTrack represents thermal activity, not a surveyed perimeter.

07 / Customers

Environmental intelligence
across different sectors

United States Capitol building

Government &
Emergency Management

Preparedness and response

  • FireOutlook
  • FireTrack
  • Incident replay
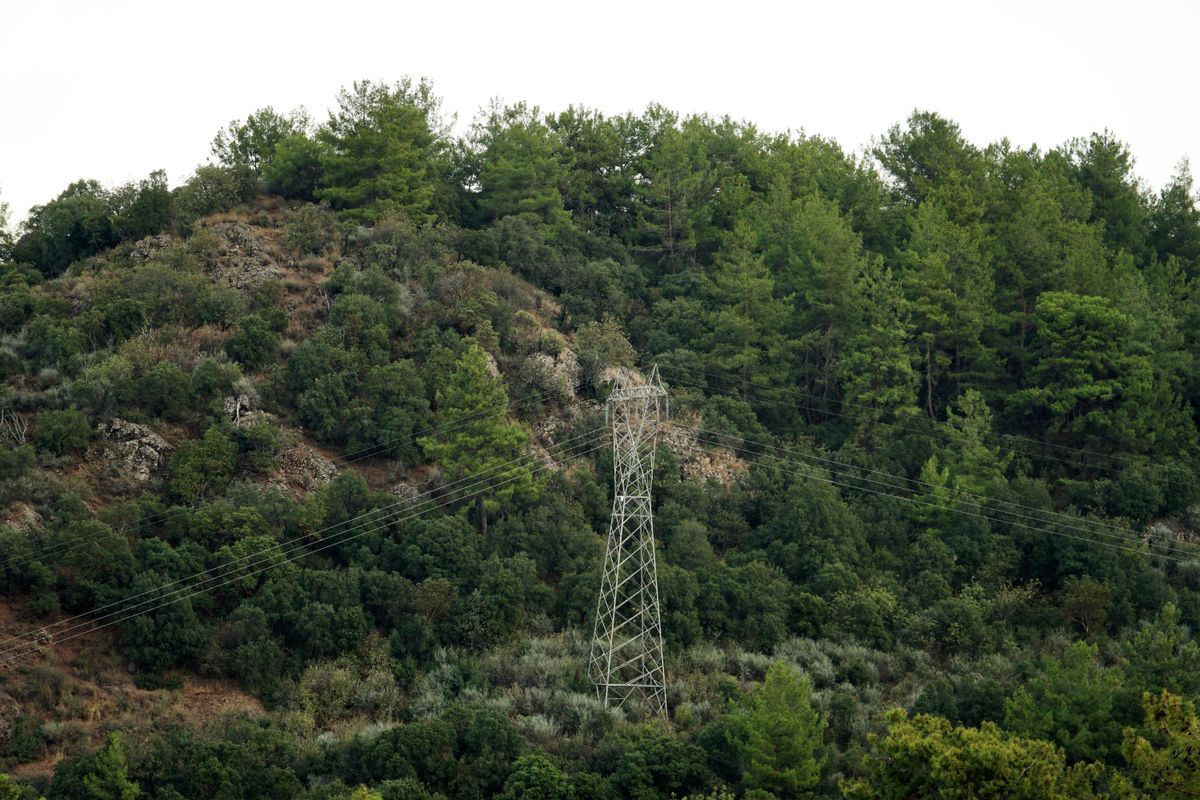
Transmission lines crossing a forested hillside

Utilities &
Infrastructure

Asset and network monitoring

  • Local outlook
  • Thermal history
  • Satellite imagery
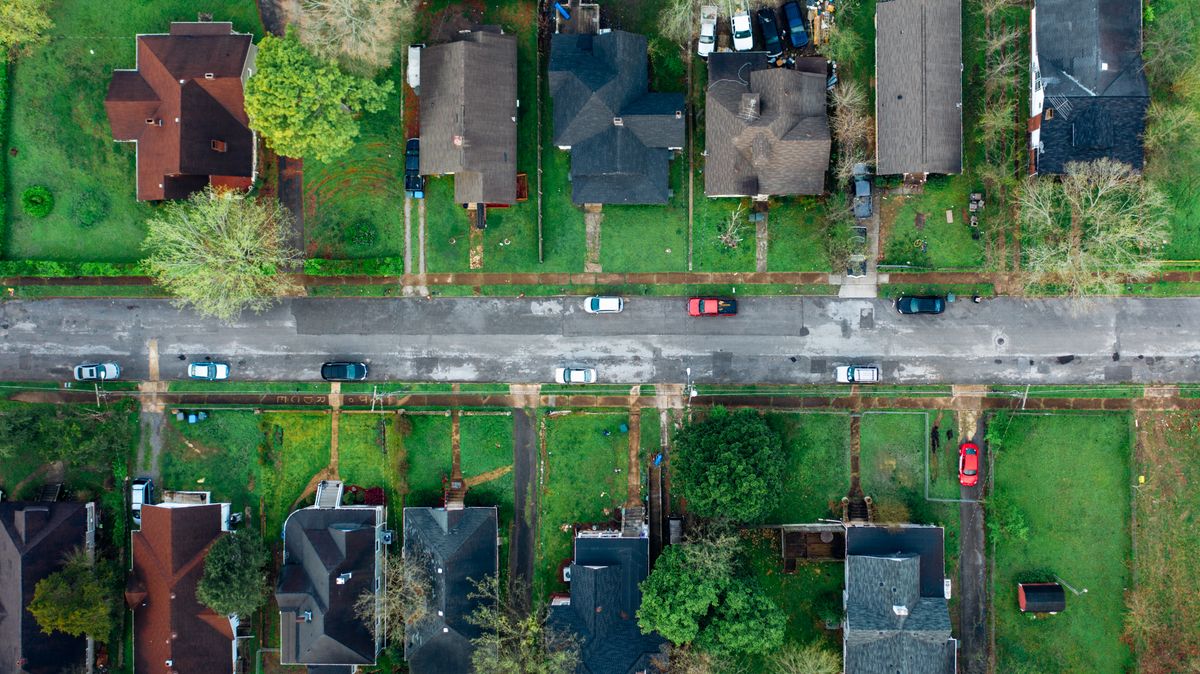
Aerial view of residential properties

Insurance &
Financial Services

Exposure and event analysis

  • Historical observations
  • Environmental layers
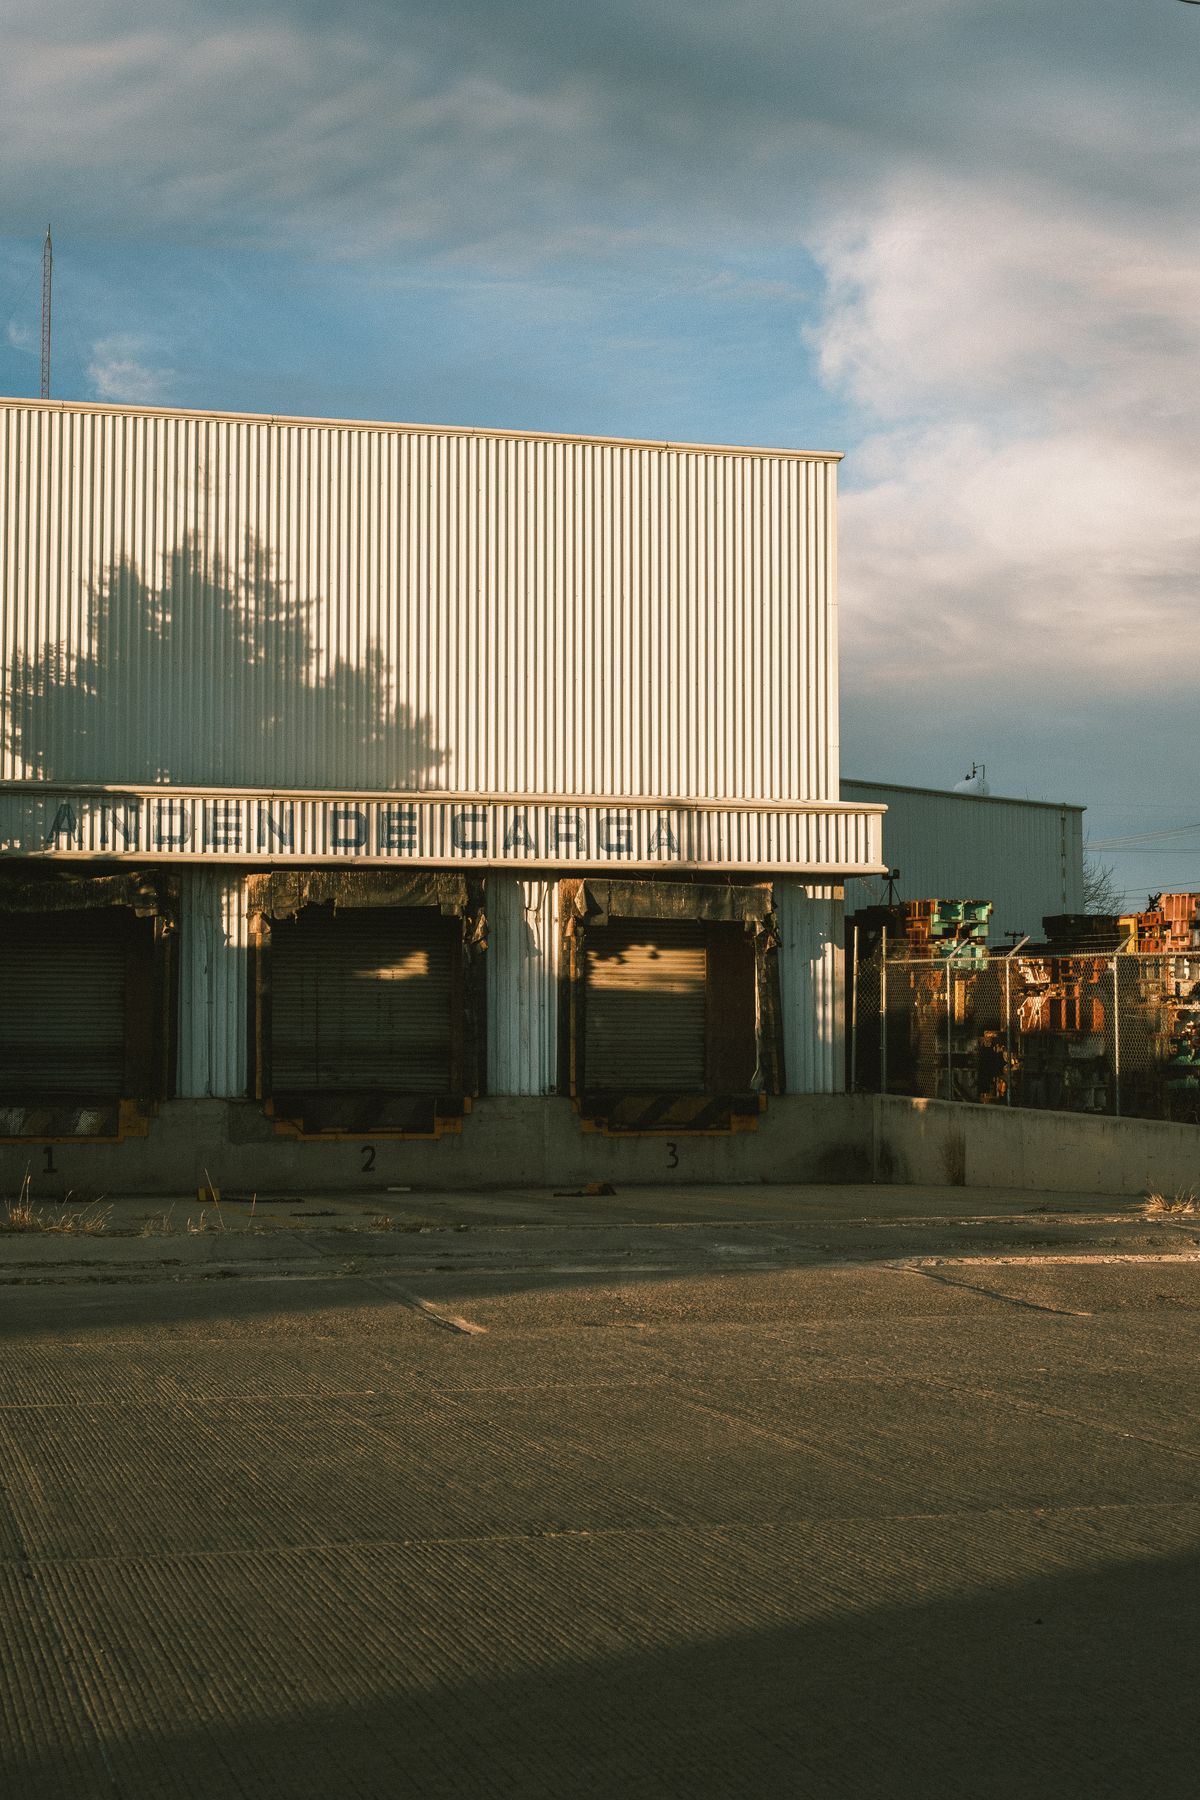
Warehouse loading docks and logistics facility

Enterprises &
Asset Owners

Operational continuity

  • Location monitoring
  • Alerts
  • Reports
Research & Analytics Teams
Integrate ARTH data into your own models and GIS workflows.Satellite radiance, environmental layers, and historical observations.
08 / Progress

Product development
and commercial engagement

Demonstrable capabilities

01

Observe and anticipate: thermal reconstructions, FireScore, and day-ahead FireOutlook.

02

Assess and review: FireTrack replay, regional summaries, and dated reference observations.

03

Integrate: radiance, fire-monitoring data, and historical records for customer systems.

REQUESTED QUOTATION

UTRGV

~$50Kquoted annually · proposed three-year scope

A data quotation prepared and sent at UTRGV’s request.

Quotation only; no agreement or revenue booked. Rate card and calculation ↗

NEXT COMMERCIAL MILESTONE

Conversion of customer evaluations into annual data subscriptions or application contracts.

09 / Competitive edge

Building ARTH’s competitive edge
Science, integration, and learning

SCIENTIFIC KNOW-HOW

Atmospheric science
meets reconstruction.

Physics-aware GeoAI

The team brings atmospheric-science and remote-sensing AI experience, including prior GEO AI work deployed in EPA/NOAA systems.

Build on this expertise with reproducible spectral and spatial benchmarks.
INTEGRATED ENGINEERING

From reconstruction
to a working application.

Radiance → FLARE

Reconstructed imagery, FireScore, FireOutlook, and FireTrack replay are brought together in the demonstrated product workflow.

Replication requires both the data pipeline and the application integration.
EVALUATION-DRIVEN LEARNING

Turn case studies
into measured evidence.

Replay + references

Dated thermal observations and incident replay provide a basis for evaluating performance across events and conditions.

Next: quantify errors, detection performance, and delivery reliability.
Defensibility grows through scientific know-how, integrated engineering, and measured performance.
10 / Business model

One data layer
Four revenue streams

01

Data-as-a-Service

Reconstructed radiance, derived layers, and historical archives for customer models, delivered through API, COG, and Zarr.

Recurring: annual data access with usage-based credits.
$0.025–$0.05 / creditProposed credit-based pricing
02

Solution-as-a-Service

Tailored dashboards, alerts, reports, and workflows for teams that need operational decision support.

Recurring: annual contracts scoped to workflow and service needs.
$25K–$250K / yearScope, geography, integration, and support
03

Scientific Consulting

Custom environmental investigations: dredging and fisheries, agricultural heat stress, and scientific risk assessments.

Project fees: paid investigations and custom scientific analysis.
$10K–$500K / projectScope-based fees · target high-margin specialist work
04

Forecast Intelligence

Observation-constrained forecasts for fire risk, smoke arrival, crop heat stress, and flood persistence.

Recurring: proposed premium subscriptions for validated forecast products.
Premium subscriptionProposed offering; domain-specific validation

Commercial model and proposed pricing.

11 / Team

Leadership and technical expertise

Manju Smriti
FOUNDER & CEO

Manju Smriti, MPA

Commercial strategy and institutional engagement

  • MPA, Cornell Brooks School of Public Policy.
  • Experience spanning Cornell, UN DPPA, and the U.S. GAO.
  • Leads business development, partnerships, and company operations.
Alqamah Sayeed
CSO · CO-FOUNDER

Alqamah Sayeed, PhD

Atmospheric science and geospatial AI

  • Currently Science Lead for NASA EarthRISE.
  • Atmospheric science and remote sensing AI.
  • Prior GEO AI work deployed in EPA/NOAA systems.
  • Leads ARTH’s radiance pipeline, FireScore, and FLARE architecture.
12 / The raise

$500K pre-seed financing
for validation and commercialization

A 12–18 month operating plan covering product validation, data delivery, and customer acquisition.

Target: 2–3 paid deployments, followed by annual-contract conversion.

Talk to the founders ↗

msmriti@bridgerpf.org
cso@bridgerpf.org

30%SALES & GTMCustomer evaluations → paid deployments.
30%ENGINEERING & SCIENCEReproducible benchmarks → stronger product evidence.
25%INFRASTRUCTUREMeasured reliability → repeatable data delivery.
15%OPERATIONS & LEGALContracts and operating readiness → supported annual accounts.

Proposed use of funds · 12–18 month operating plan

13 / Appendix / Pricing

Rate card and
UTRGV quotation basis

LayerCredits / tile
Shortwave radiance · I01–I030.5
Thermal radiance · I04–I051
Brightness temperature · BT04/051
FireScore (2026 rate card)1
Full bundle · RGB included2.5

Original 2026 rate card · 440 × 440 pixel tiles · Zarr / COG delivery

Annual fee = credits × rate

$0.025 / credit · qualifying nonprofit
$0.05 / credit · corporate

$50,260.50 / yearUTRGV requested quotation

At $0.025 per credit, this total corresponds to 2,010,420 annual credits.

Credit volume is inferred from the quoted total and nonprofit rate. The original appendix does not itemize UTRGV’s geography, layer mix, or delivery count.

Full bundle: 2.5 credits × rate = $0.0625 nonprofit or $0.125 corporate per tile delivery.